Where the Overview shows what is happening now, these reports show how a period went. Pick a date range, read the totals and charts, click a bar to see the conversations behind it, and download the figures.
Watch the walkthrough
Choosing the period
Every report here has the same controls at the top:
- A date picker: Last 7 days, Last 14 days, Last 30 days, This month, Last month, Last 3 months, Last 6 months, Last year or Custom date range.
- Group By: show the charts by day, week, month or year.
- Business Hours: when switched on, response and resolution times only count the hours your inbox is open (set under the inbox’s Business Hours tab), so a message that arrived at midnight is not held against your team.
Conversations
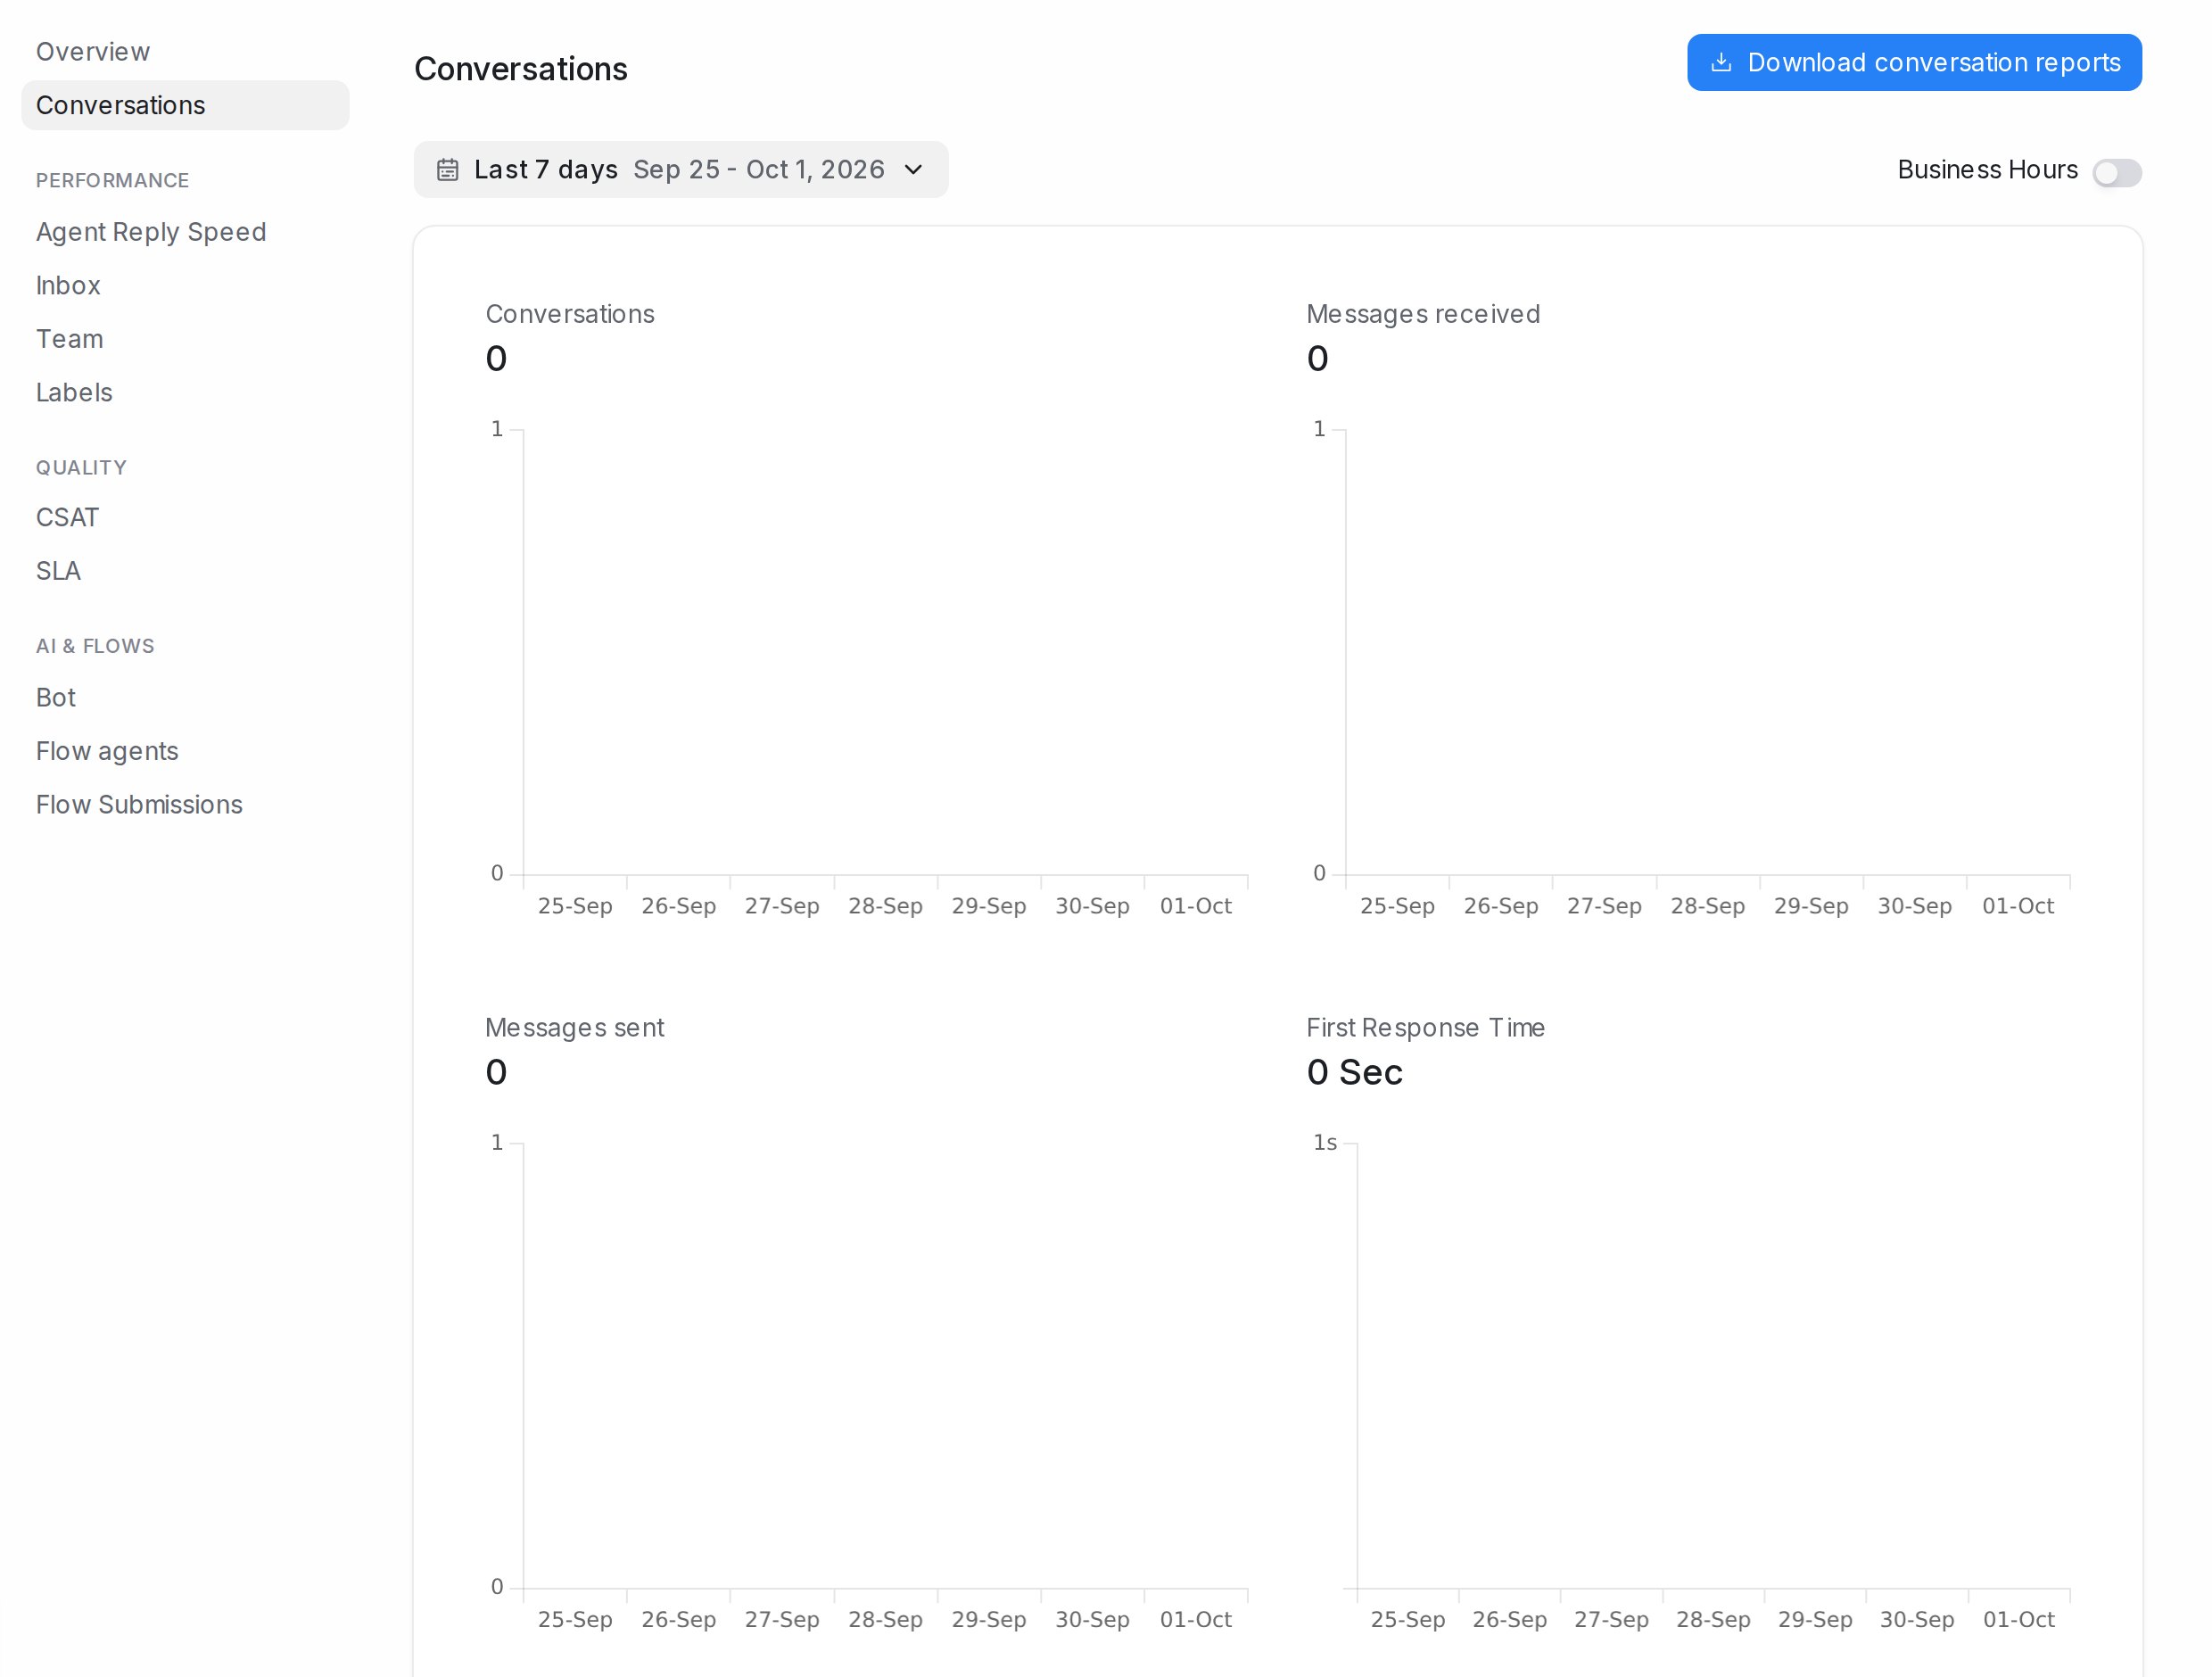
Reports → Conversations shows, for the whole account:
| Metric | Meaning |
|---|---|
| Conversations | New conversations in the period |
| Messages received / Messages sent | Customer messages in, team and bot messages out |
| First Response Time | Average time until the first reply |
| Resolution Time | Average time from opening to resolving |
| Resolution Count | Conversations resolved |
| Customer waiting time | Average time customers waited for each reply |
Click a metric to chart it. Administrators can click a bar to open its details: the conversations or messages that bar counts, with Previous bar, Next bar and Load more. Download conversation reports saves the figures as a file.
Agent Reply Speed, Inbox, Team and Labels
Under Performance in the reports menu:
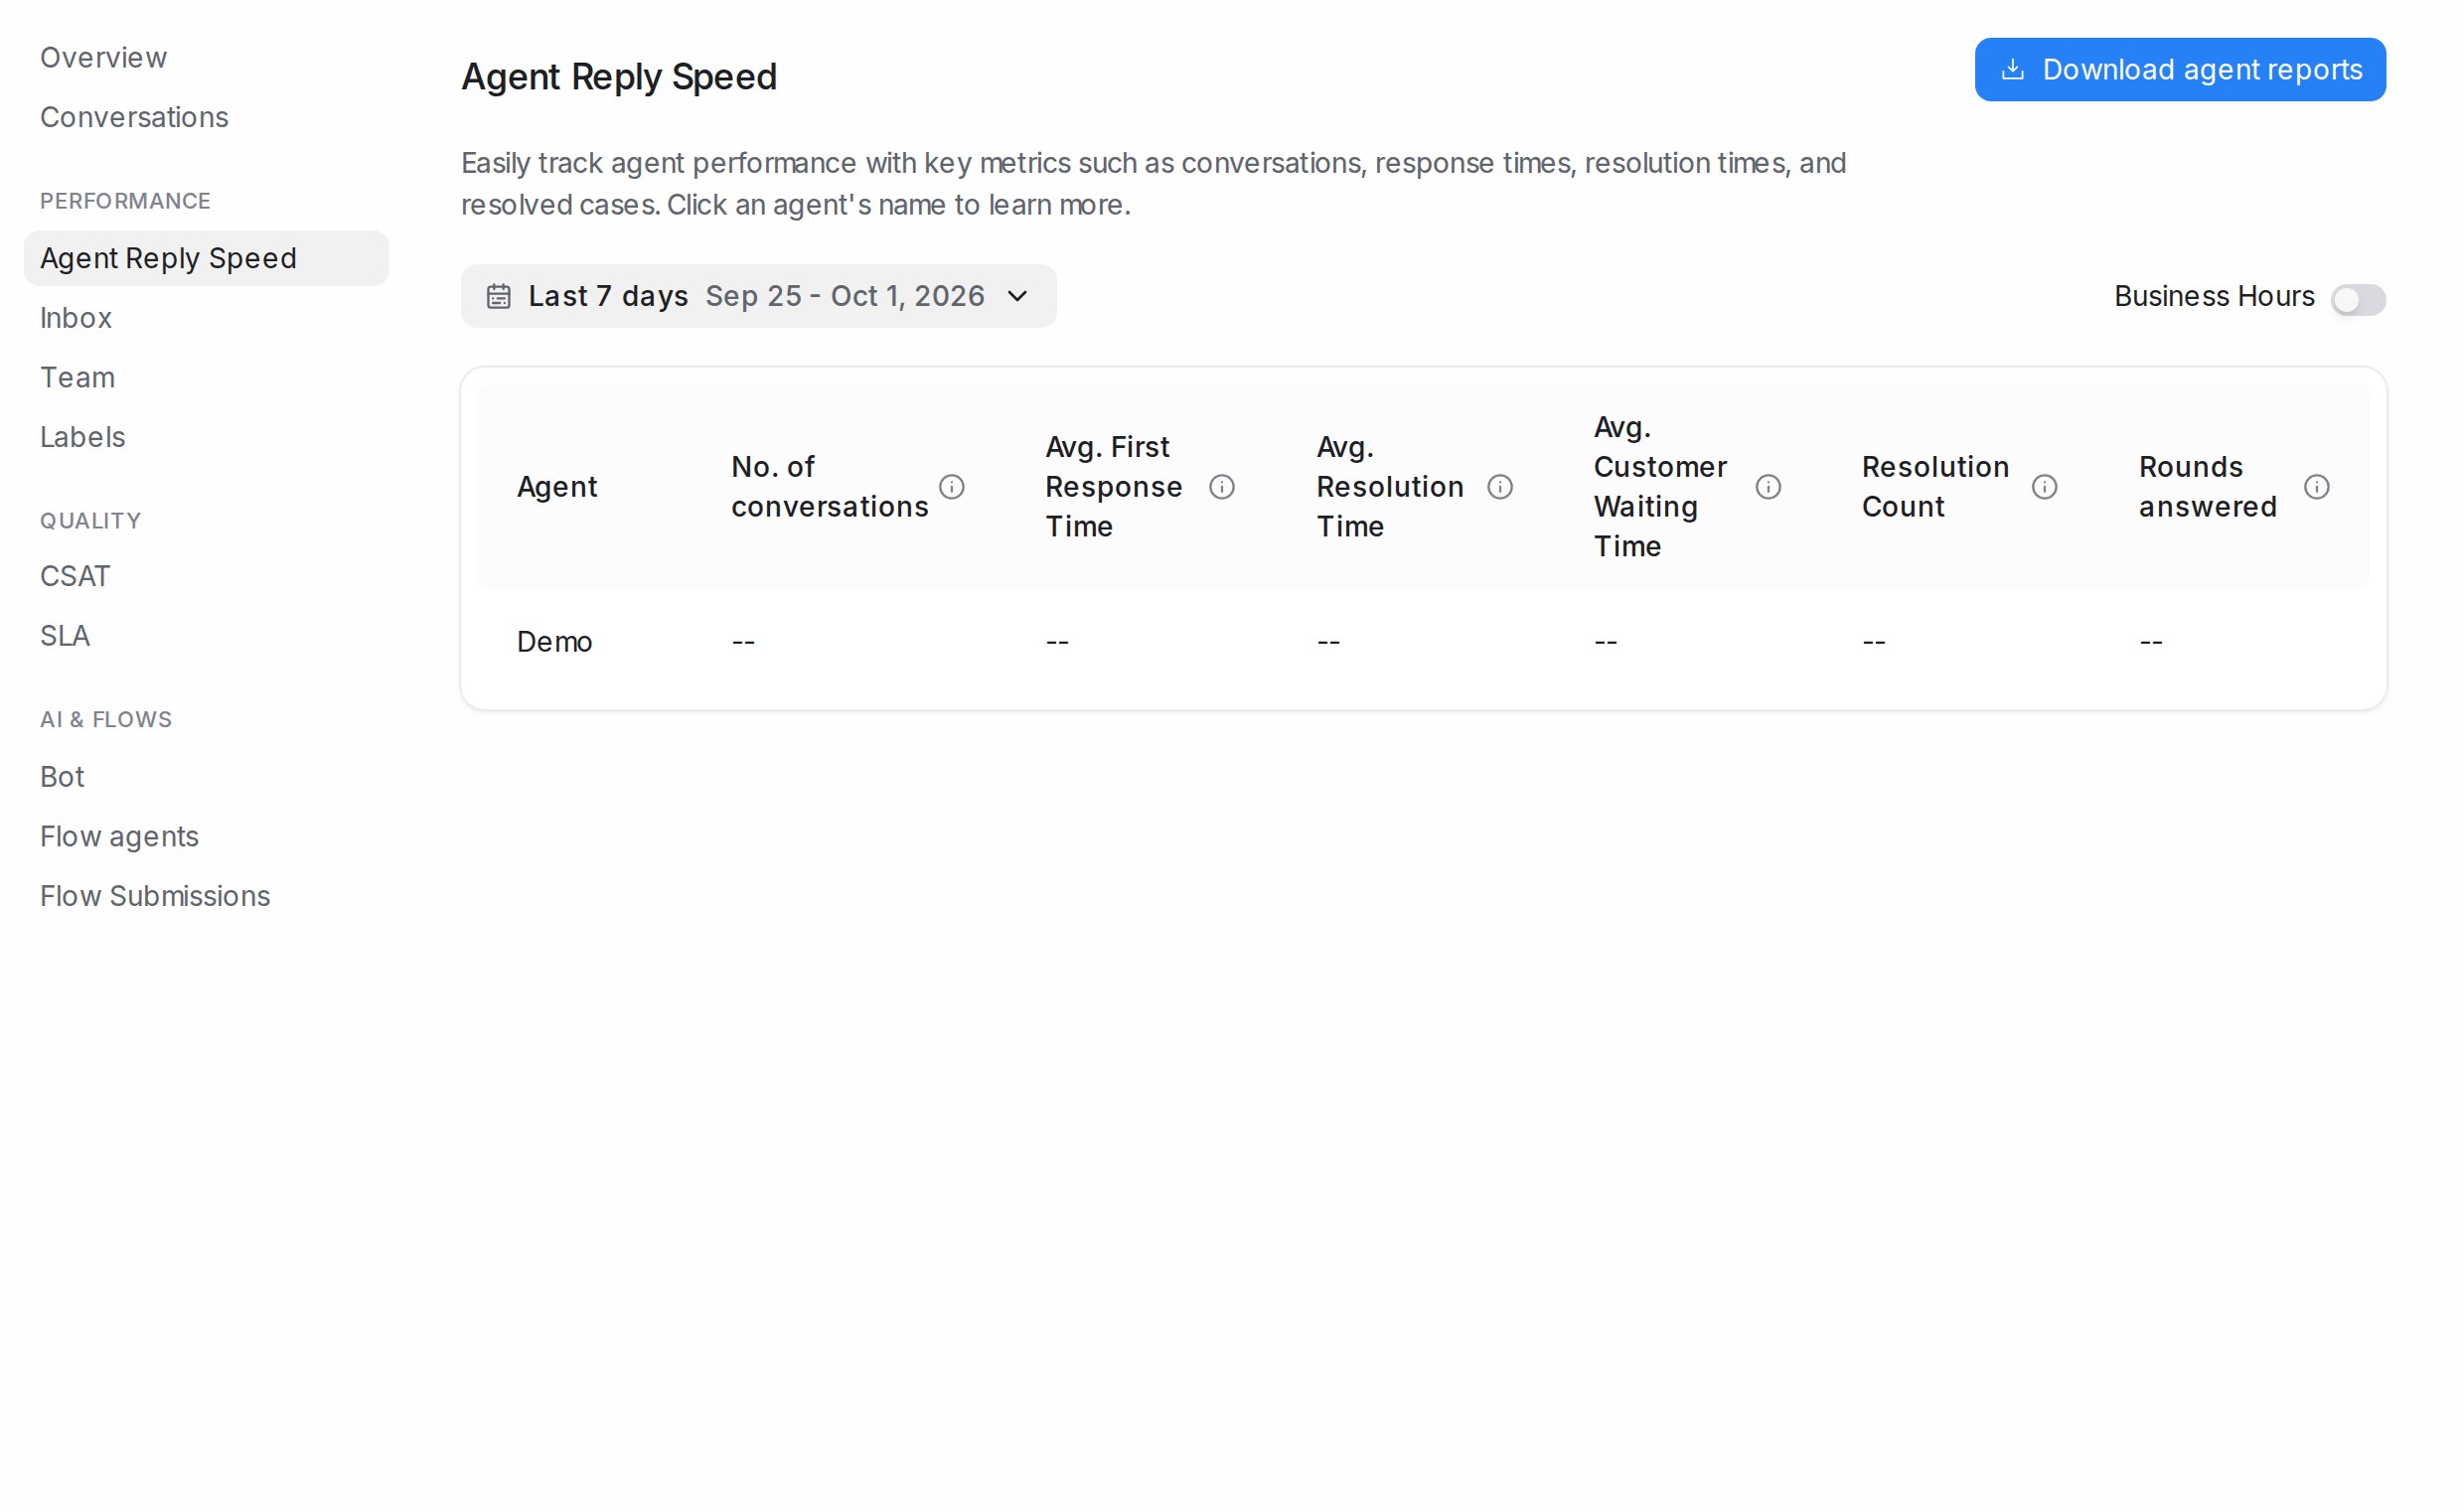
- Agent Reply Speed: one row per agent with their conversations, first response time, resolution time and resolution count. Click an agent for their own charts. Download agent reports.
- Inbox: the same figures per inbox, to compare channels. Download inbox reports.
- Team: per team. Download team reports.
- Labels: per label, to see which topics take the most time. Download label reports.